 Loading...
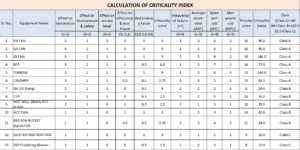
CALCULATION OF CRITICALITY INDEX FOR CRITICAL EQUIPMENT IDENTIFICATION AS PER CLASS A, B AND C FOR PROCESS /MANUFACTURING INDUSTRY….
| EQUIPMENT | TOTAL CRITICALITY INDEX SCORE | % CONTRIBUTION TO TOTAL CRITICALITY INDEX SCORE | NO OF EQUIPMENTS | INDIVIDUAL CRITICALITY INDEX RATING |
| Class – A | 2474.5 | 30.80 | 26 | >=60 |
| Class – B | 5096.93 | 63.45 | 128 | 22.5 to <60 |
| Class – C | 461.75 | 5.75 | 34 | <22.5 |
| Total | 8033.18 | 100.00 | 188 | |
| Criteria for Criticality Index | ||
| Criticality index is based on following elements: | ||
| 1 | Effect on Generation – (G) | |
| Effect on the element | Score | |
| No significant consequences on generation due to failure | 1 | |
| Generation loss < 20% | 2 | |
| Generation loss < 50% | 3 | |
| Unit tripping | 4 | |
| Station tripping | 5 | |
| 2 | Effect on Environment and Safety – (E) | |
| Effect on the element | Score | |
| No effect on Environment and Safety | 1 | |
| Very minor effect | 2 | |
| Failure leads to an accident or significant | ||
| impact on environment | 3 | |
| 3 | Effect on Service Level – (S) | |
| Effect on the element | Score | |
| Failure will not affect the work of succeeding equipment | 0 | |
| Failure will affect the work of succeeding equipment | 1 | |
| 4 | Effect on Efficiency & Aux Power (A) | |
| Effect on the element | Score | |
| No effect on Efficiency & Aux Power | 0 | |
| Very minor effect | 0.5 | |
| Failure leads to a major effect on Efficiency & Aux P | 1 | |
| 5 | Redundancy Factor | (RF) |
| Effect on the element | Score | |
| If there is no standby unit for the failed equipment | 1 | |
| If the number of standby unit is 1 | 0.5 | |
| If the number of standby unit is 2 | 0.33 | |
| Criticality Score = (G+E+S+A) X RF | ||
| Where: | ||
| G | = Effect on Generation | |
| E | = Effect on Environment and Safety | |
| S | = Effect on Service Level | |
| A | = Effect on Efficiency & Aux Power | |
| RF | = Redundancy Factor | |
| 1 | Frequency of Failure- (FF) | |
| Effect on the element | Score | |
| Once per year or rare | 1 | |
| Twice in a year or once per six months | 2 | |
| Four times in a year or once in ¾ months | 3 | |
| Frequent failures or more than 4 failures in a year | 4 | |
| 2 | Average Down Time- (ADT) | |
| Effect on the element | Score | |
| If Down Times is 0 to ½ Day | 1 | |
| If Down Times is 1/2 to 1 Days | 2 | |
| If Down Times is 1 to 3 Days | 3 | |
| If Down Times is 3 to 7 Days | 4 | |
| If Down Times is more than 7 Days | 5 | |
| 3 | Spare Parts Cost – (SPC) | |
| Effect on the element | Score | |
| Cost of spares up to Rs 25,000/- | 1 | |
| Cost of spares from Rs 25,000/- to 50,000/- | 2 | |
| Cost of spares from Rs 50,000/- to 1,00,000/- | 3 | |
| Cost of spares from Rs 1,00,000/- to 5,00,000/- | 4 | |
| Cost of spares from Rs 5,00,000/- to 10,00,000/- | 5 | |
| Cost of spares from Rs 10,00,000/- to 50,00,000/- | 6 | |
| Cost of spares from Rs 1,00,00,000/- to 5,00,00,000/- | 7 | |
| Cost of spares above Rs 5,00,00,000/- | 8 | |
| 4 | Man Power Cost (MPC) | |
| Effect on the element | Score | |
| If Cost of Man Power to attend the | ||
| failure is Rs 10,000/- or less | 1 | |
| If Cost is form Rs 10,000/- to 1,00,000/- | 2 | |
| If Cost is above Rs 1,00,000/- | 3 | |
| Priority Score = (FF x SPC) + (ADT x MPC) | ||
| where | ||
| FF | = Frequency of Failure | |
| SPC | = Spare Part Cost | |
| ADT | = Average Down Time | |
| MPC | = Man Power Cost | |

